Overview
Monitor ad-hoc tasks, task completion rates, and caregiver scheduling to optimize resources and improve care management. The Tasks app helps identify inefficiencies and enhance operational efficacy. Reports included in the package: ADL Overview, ADL Trends, Additional Task Summary, and Assignment Management.
Note: the reports are all on a standardized refresh schedule. Check the Last Refresh date to know when the report was last updated.
ADL Overview Report
At-a-glance insights on resident task load and completion using leaderboards. Dive into data like the percentage of undocumented tasks over the last two weeks, CareMobile compliance percentages, and additional task details.
Data can also be exported, filtered, and drilled down. For example, users could select AL in the Service Type and Complete in the Status filter.
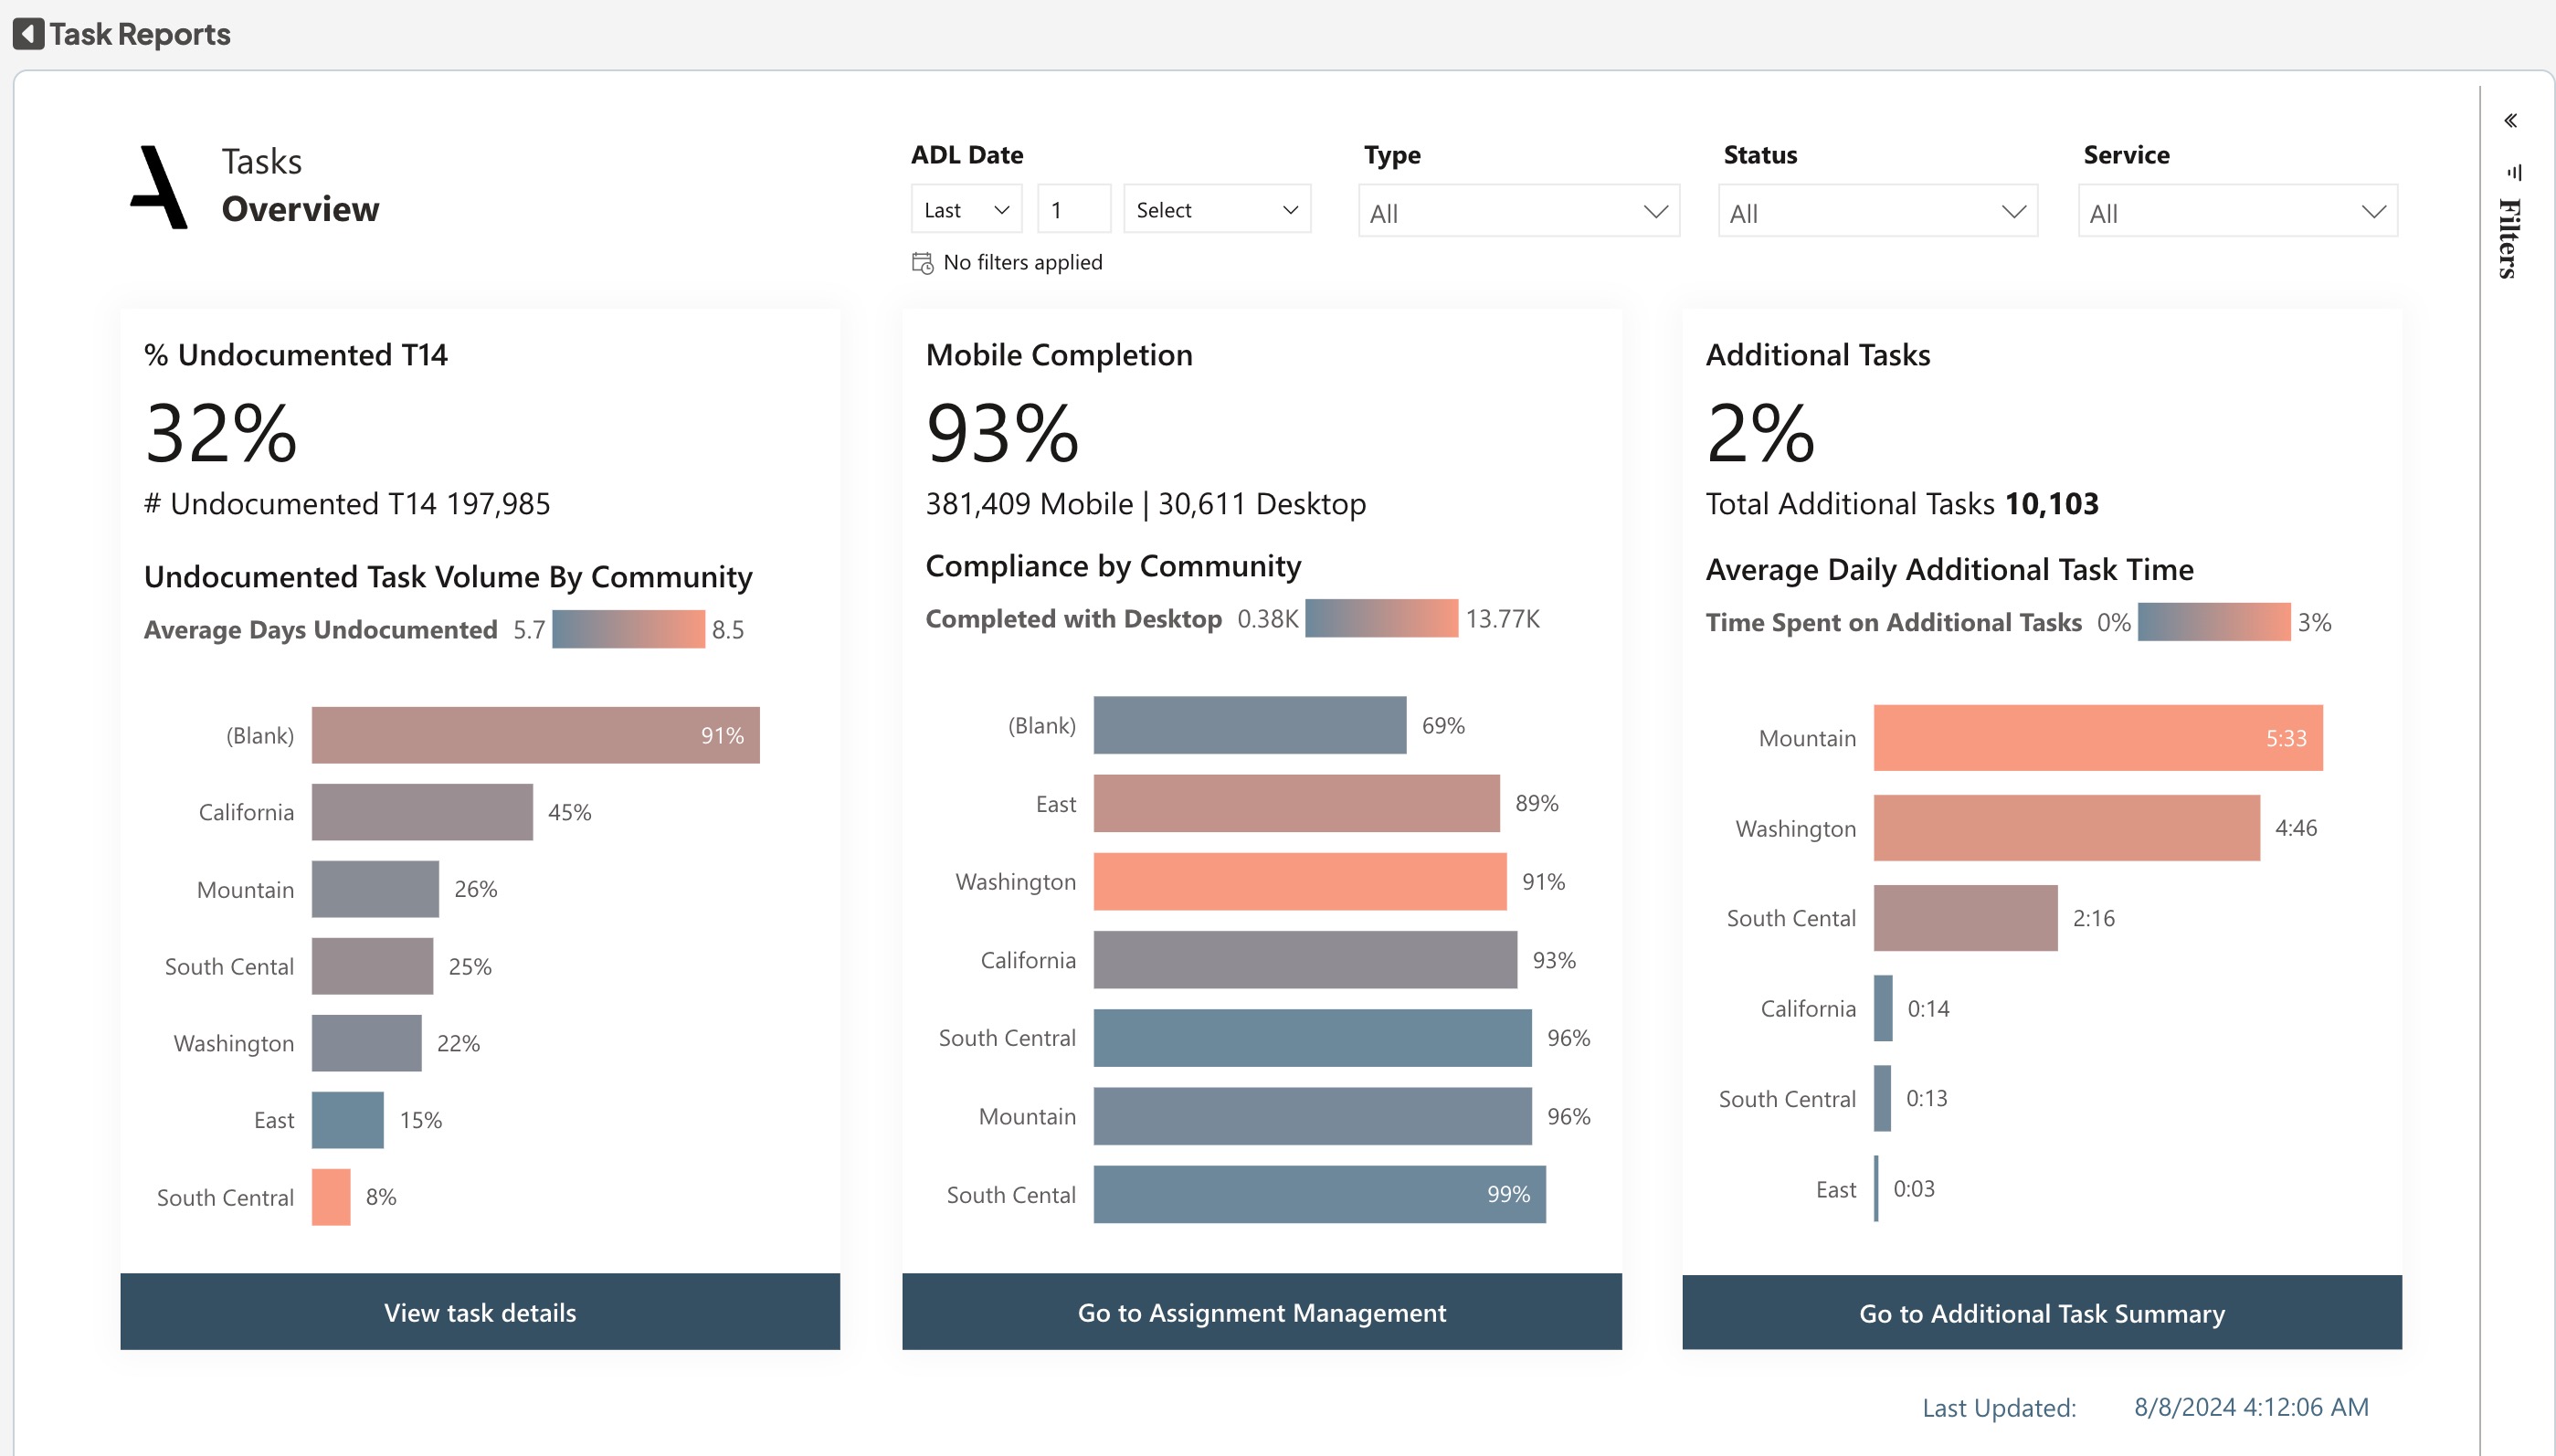
Identity areas that need attention with the Incomplete Tasks chart and spot areas where tasks are frequently left unfinished. Monitor mobile completion to ensure that employees are following proper protocols.Track the average number of additional tasks assigned to residents to identify individuals who may need additional support or intervention based on their task load.
The Undocumented task bar chart drill down is shown in a bar chart, descending from the region to the community level to the resident. The Mobile task bar chart drill down is shown in a bar chart, descending from the region to the community level to the Community Resource Role. The Additional task bar chart drill down is shown in a bar chart, descending from the region to the community level to the Resident. The buttons beneath chart navigate to related, more detailed analysis pages.
Dimensions:
- Drill-down Dimensions from Region to Community
- Drill-down Dimensions from Region to Community to Community Resource Role
- Drill-down Dimensions from Region to Community to Resident
ADL Overview metrics and their definitions:
#Undocument T14: The no. of tasks from the last 14 days that are still in "Open" status. These are tasks that can still be closed before the system auto-closes them.
%Undocument T14: The percentage of tasks from the last 14 days that are still in "Open" status. These are tasks that can still be closed before the system auto-closes them.
#Mobile Completion: The Total number of tasks marked as complete using the mobile application.
%Mobile Completion: The Percentage of tasks marked as complete using the mobile application.
#Additional Task: The total tasks that are additional.
%Additional Task: The percentage tasks that are additional.
Task(Active Residents):The number of tasks completed by the occupants who are actively involved.
Average Daily Additional Minutes: Average time for the additional minutes taken for the task.
ADL Trends Report
Get a quick overview of the task flow trend with reports like Average Task Time per Resident and Key Influencers / Top Segments. Data can also be exported, filtered, and drilled down.

Used to monitor the average task time and average daily task time trend depending on various factors. Analyzing the Average Daily Task Time based on Assessed care level, Assessed care type, Room type style code, Payor type, Service code description and ADL hours.
Dimensions:
- Drill-down Dimensions from Region to Community
ADL Trends metrics and their definitions:
Average Task Time per Resident: The average Task time spent on tasks per Resident
Daily ADL Time for Resident: Calculates the average amount of ADL time per resident per day
Average Daily Task Time: Calculates the average amount of ADL time per community per day.
Additional Task Summary Report
Understand resident needs and improve service delivery with data sets like Average Daily Additional Tasks, Average Daily Additional Time, and Percent of Time Spent on Additional Tasks.
Data can also be exported, filtered, and drilled down.

Analyze the Average Daily additional task per Resident leaderboard to identify residents who may require further assessment or intervention. Evaluate the efficiency and effectiveness of different services using the Average Daily Additional Time per Service chart. Gain insight into additional tasks — how often does the task occur? What kinds of tasks? When did this start occurring?
The percentage of ADL time allotted to Resident Additional Task activities in relation to the total ADL time is shown in the line chart. Based on the type of care, the area chart illustrates the average daily additional minutes on a weekly basis.
Dimensions:
- Drill-down Dimensions from Region to Community to Resident
- Drill-down Dimensions from Service Code Description to Resident
- Drill-down of Date hierarchy (year, quarter, month, day)
Additional Task Summary metrics and their definitions:
#Additional Task: The total tasks that are additional
%Additional Task: The percentage tasks that are additional
#Communities: The total count of communities
Average Daily Additional Tasks: Calculates the average number of Resident Additional Task activities per community per day
Additional Minutes: Calculates the total amount of time spent on Resident Additional Task activities
Average Daily Additional Minutes: Calculates the average amount of time spent on Resident Additional Task activities per community per day
% Time Additional: Additional minutes taken divided by ADL Time
Assignment Management Report
Assists with balancing workloads, identifying task concentration, and tracking overall task performance. Dive into the data using charts like Average Daily Task Time, Average Daily Hours by Resource Role, Average Daily ADL Hours by Time of Day, Average Daily Task Hours Over Time, Average Daily Resident Task Time, and Average Daily Time Per Resident.
Data can also be exported, filtered, and drilled down.

The Average Daily hours per Resource Role leaderboard allows you to identify any imbalances in workload distribution among your team. The Average ADL Hours by time of day chart helps you to pinpoint times where tasks may be too concentrated, helping you make informed decisions about redistributing tasks and avoiding excessive workload for certain employees or team members.
The line chart helps you identify trends, patterns, or fluctuations in task completion, allowing you to make data-driven decisions to improve processes and plan resources effectively. Based on the resident, Care Type, Community and Region, the Bar chart assists you in determining the daily ADL time per resident.
Dimensions:
- Drill-down from Resource Role to Employee
- Drill-down from Month to week to date
- Drill-down from Resident to Community to Assessed Care Type to Resident
Assignment Management metrics and their definitions:
Average Daily Task Time per Community: Calculates the Average Daily Task Time per resident by Community
Average Daily ADL Hours: Calculates the average amount of time spent on ADL activities per community per day,expressed in hours
Average Daily Task Time: Calculates the average amount of ADL time per community per day.
Average Task Time per Resident: Calculates the average amount of time each resident spends on ADL tasks per day, expressed in hours
Details Report
Enables task understanding and resident-centric decision making.
Data can also be exported, filtered, and drilled down.

Task Details, Task Summary, and Additional Task Details are provided on the Details page.The Task Details table provides a comprehensive overview of completed tasks, including important details such as resident, service, task type, and timestamps. This allows you to better understand the nature of each task and make informed decisions regarding allocation or assessment.
The Resident Overview tab allows you to analyze key metrics such as Average daily per Resident, Undocumented Task, Additional Task and Additional minutes based on Region, community and Resident
Was this article helpful?
That’s Great!
Thank you for your feedback
Sorry! We couldn't be helpful
Thank you for your feedback
Feedback sent
We appreciate your effort and will try to fix the article